Compound
Thesis DBAboutPortfolioWriting

2026 Compound

Compound
Thesis DBAboutPortfolioWriting
Back to Database
2-Sided Marketplace
AI/MLHealthcareCryptoOtherBio

2-Sided Marketplace

Solving search, trust, and friction

Overview

Two‑sided marketplaces matches supply (providers) with demand (buyers) and monetizes the match, usually via a take rate (a % of GMV), per‑transaction fee, or a subscription to access the network. Marketplaces solve search, trust, and logistics frictions; the resulting liquidity (speed + probability of a successful match) creates network effects that can become a moat.

There are same-side and cross-side network effects, which each may be positive (e.g. more sellers on Amazon begets more buyers) or negative (e.g. sellers compete with other sellers).

It requires focus to decide which parties to prioritize in what order amongst suppliers, buyers, and often other stakeholders, especially before the network has achieved escape velocity. Because both sides have networks effects in and of themselves that reinforce each other, 2-sided marketplaces have far higher barriers to entry than 1-sided (which are more about monetizing customer loyalty).

Even two-sided markets with strong positive network effects may not have winner-take-all dynamics and be optimally supplied by a single platform at mature scale if the market doesn’t have high multi-homing / switching costs, similar needs amongst all consumers or practically indefinite returns to scale.

Marketplace vs. Platform vs. Aggregator:

Platforms enable transactions (APIs, tooling) and are often essential to make products work; value accrues by facilitating the relationship. Aggregators specifically aggregate demand, often commoditizing suppliers. The network is “internalized.” Platforms tend to support supplier differentiation; aggregators often compress it. 

Pros

  • Winner take most if not all: flywheel of more supply → better selection/ETAs/price → more demand → more supply
  • Asset‑light scale: inventory/capacity sits with suppliers.
  • Can layer on multiple monetization vectors: take rate + ads + subscriptions + fintech (payments, lending, insurance)
  • Durability once dense: mature cohorts can look SaaS‑like in retention/expansion

Cons

  • Cold‑start & subsidy drag: you fund one or both sides until the market’s liquid
  • Early margins: unit economics generally only work at scale

When the model fits

Use a two‑sided marketplace when all are true:

  1. Fragmented supply or demand with high search costs or trust gaps.
  2. High heterogeneity (not all sellers or jobs are interchangeable) where ranking/QA truly helps.
  3. Reusable transaction loop (frequency or high LTV) so CAC can amortize.
  4. Operational leverage from density (route batching, faster ETAs, better match rates).
  5. Clear wedge to initial liquidity (single geo + category, or a “tool‑to‑marketplace” wedge using workflow SaaS that later turns on demand). In healthcare specifically, platforms with workflow + network have shown better fundraising and exit odds. 

Mechanics of the model

  • Liquidity > everything. Instrument match rate, time‑to‑match, fill rate, ETAs, % successful first quotes. Set SLAs where possible.
  • Reduce multi‑homing. Provide supplier tools (scheduling, compliance, financing, insurance), demand‑side benefits (trust coverage, refunds), and identity/reputation portability only inside your network.
  • Start with a specific niche and expand from there. Over time, it’s important to understand boundaries of networks. For instance, Facebook had tried to create a Facebook for Work subsection. But it turned out that people demanded separating their work and social online lives. That allowed LinkedIn to flourish.
  • Study cohorts, not averages (GMV, CAC & CLV by side, incentives, fraud, refunds)
  • Layer revenue after liquidity. Start with a modest take rate to seed both sides; once frequency and trust rise, add: Advertising/featured placement (high‑margin; proven in health platforms too), Fintech (payments, instant payouts, receivables finance, insurance).
  • Take-rate at scale are often 8-30% as seen below. A heuristic is: Take rate ≈ Convenience + Net‑new demand generated by platform − Competition.
    Model image

Pricing

Multi-sided generally networks shouldn’t price via traditional rationale (i.e. marginal cost for competitive industries and WTP for those with high barriers as seen in the top graph). Instead, they must take into account network effects and the particulars of each side in their pricing strategy, often resulting in a subsidy for one side.

  • User sensitive to price: it may be maximally profitable to subsidize the more price sensitive side while charging the side whose demand will increase most in response to a growth in the other side. E.g. Adobe shifted from charging both sides to giving away the reader for free to the consumer and charging the document writer. The writer was less price sensitive and would pay more for access to a audience than pdf readers would pay for access to writers.
  • User sensitive to quality:
  • n other cases where a group adds existentially important value to starting the flywheel, subsidize them. For example, Microsoft realized before Apple did that they shouldn’t be charging application developers in their pursuit of building the dominant operating system.
Model image
Model image

Note that one must of course be careful with subsidization, especially if the good has meaningful marginal costs (most physical goods) or if you paying side can avoid paying for your services (e.g. Netscape subsidized its browser to individuals but web site operators didn’t have to buy their servers).

Further Reading

The Cold Start Problem: How to Start and Scale Network Effects

Strategies for Two-Sided Markets

https://blas.com/matchmakers/

https://abovethecrowd.com/2015/01/30/ubers-new-bhag-uberpool/

https://abovethecrowd.com/2014/07/11/how-to-miss-by-a-mile-an-alternative-look-at-ubers-potential-market-size/

https://blog.brianbalfour.com/p/the-next-great-distribution-shift

https://papers.ssrn.com/sol3/papers.cfm?abstract_id=1177443

Two-Sided Competition of Proprietary vs. Open Source Technology Platforms and the Implications for the Software Industry

https://www.michaeldempsey.me/blog/2025/10/03/sequencing-vs-equal-odds-applied-research/

https://www.danhock.co/p/llms-vs-marketplaces

https://stratechery.com/2024/an-interview-with-zillow-ceo-jeremy-wacksman-about-evolving-strategy/

https://stratechery.com/2015/netflix-and-the-conservation-of-attractive-profits/

Instacart

Each cohort-year, more revenue than the year prior, except for the COVID cohort (2020) (not surprising - many that year were forced in). More impressively, all other cohorts held on to COVID bumps -- eg., 2017 cohort in years 3-5 was 1.74x, 3.0x, *3.2x* of year 1 GTV. The bump stuck!

So while $CART is B2C, it has the revenue durability of a so-so SaaS company. $CART beat us over the head with this superannuity point later on with this figure:

Model image

Instacart+ is an impressive driver of growth and durability

It is astounding how big the subscription program is. 57% of $CART's revenue comes from subscribers. 5.1M members in Q2 2023, vs 7.7M monthly actives then.

Model image

https://www.linkedin.com/pulse/instacarts-s-1-bodes-well-underlying-strength-daniel-mccarthy/

DoorDash
  • DoorDash spends about $6 to acquire each new customer. [ Note: DoorDash notes themselves that they spend upwards of 10% of GOV on sales and marketing in year 1. As noted above, initial AOV is around $30, but this is a mix of new and repeat purchases, which is why CAC must be higher than 10% - $6 is 20% of that initial order. ]
  • When I reverse out the beneficial impact of COVID, I infer that customers place about 14 orders on average in their first 3 years with the firm, but again, these orders are back end loaded because order frequency goes up with customer tenure.
  • DoorDash's gross margin has been improving over calendar time (i.e., all customers' gross margins are expanding over time) and as a function of customer tenure (i.e., customers' gross margins are increasing as customers age). While their gross margin in year one is ~2%, it rises to about 12% by year three. Again, very back end loaded.
  • DoorDash spends about 2.3% of GOV on sales and marketing for repeat orders. This has been fairly consistent over time.
  • Netting gross margin against sales and marketing for repeat orders, this implies DASH's contribution margin grows from about 0% in year one to about 10% by year three.
  • Present valuing this stream of variable profits, I estimate a three-year "post-acquisition value" of about $21. Subtract off the $6 of CAC, and we get a $15 CLV, implying a marketing return on investment of 250% in just the first three years.
  • When we extend the horizon on our customer profitability calculation from three years to five years, my estimate of their post-acquisition value goes up to ~$60, implying a CLV of ~$54, or a ~900% marketing ROI.
  • This is a very strong return on investment. And if DoorDash can continue holding onto and monetizing these customers in future years, those PAV estimates continue to go up and up.

    That said, I would be remiss if I did not mention that the absolute dollar amount of this return is not all that large. A five-year CLV of $54 is not a whole lot of value in an absolute sense. This is primarily due to the very thin margin profile of the firm. What sort of overall corporate valuation does this imply? To justify a valuation of $25-30B+ when a lot of the core market has already been acquired, it would seem like we may need to see something more -- a transformative new vertical, or a way to dramatically expand TAM.
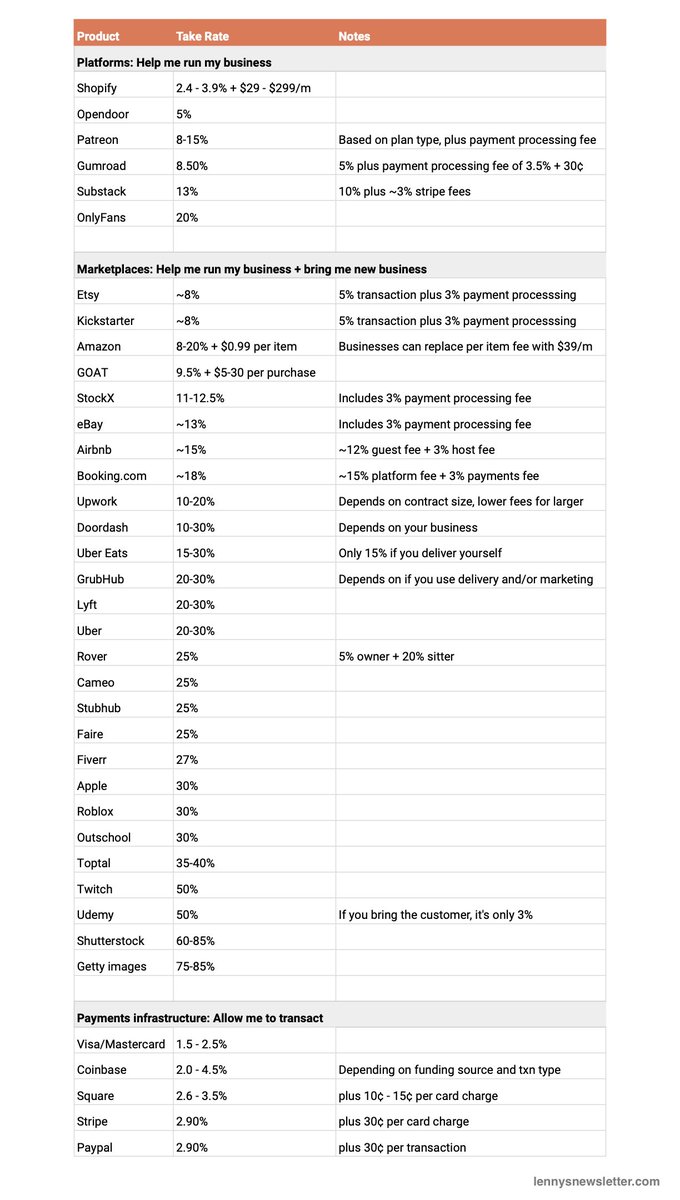
    https://www.linkedin.com/pulse/doordash-great-unit-economics-many-unanswered-daniel-mccarthy/

    Takeaway #1: There is a relatively clear distinction between “platform” businesses taking 5-15% (which make it easier for you to run your business, e.g. @Patreon @SubstackInc), and Marketplaces taking 10-50% (which bring you new business as well, e.g. @DoorDash @BookCameo)

    Takeaway #2: Differences in take rates are primarily driven by three factors: (1) whether you can drive new demand, (2) how much convenience you provide the seller, and (3) the level of competition in the market.Take rate = Convenience + Demand - Competition

    3/ For example: Gumroad (8.50%): High convenience + Little demand gen - Medium competition Substack (~13%): Very high convenience + Little demand gen - Medium competition Twitch (50%): Very high convenience + Very high demand gen - Very low competition

    4/ Surprises:1. @OnlyFans (a platform that doesn’t bring any demand) is able to charge 20% (a rate normally reserved for marketplaces). This is because they solve a major pain point for their creators (e.g. accepting payment for sex work) and there isn’t much competition.

    2. @Etsy's fees are at the low end of the spectrum for a marketplace (i.e. even lower than Substack, which doesn’t drive demand). This is probably because of heavy competition with Amazon.

    3. @toptal is able to charge close to 40% as a labor marketplace. This is likely due to how much time and effort the platform saves both supply and demand.

    4. @Twitch takes 50%. This likely speaks to the quality of the product and the significant network effects.5. @Shutterstock and @GettyImages take up to 85%. This is likely due to how little work there is to get paid once you’ve uploaded your photos.

    https://x.com/lennysan/status/1386706274037891075

    that amazon number is way too low. if you don't go with FBA the shipping requirements are so high it's very hard to get prime. no prime shipping = sales tank. so realistically FBA is more like 25-30% when you put in all the fees. not counting advertising which is another 8-10%

    Audible takes 60-75% commission on each audiobook sale

    (60% if you sign a multi-year exclusive deal with them, 75% otherwise.)

    YouTube: 45% (ads) Instagram takes 100% (of revenue from ads they sell; no automatic share with top creators)

    Stat from Instacart that highlights the moat these ZIRP-era companies have: “It took us 100 million orders before we were able to get to positive unit economics”

    At a Glance

    Categories
    AI/MLHealthcareCryptoOtherBio
    Definition
    Solving search, trust, and friction

    Related Models

    SaaS for Biopharma

    Selling white coats software

    Franchising

    For supply-constrained goods requiring local operators

    Platforms

    Facilitate relationships between users and 3rd-party developers

    2026 Compound