
Selling software to hospitals, doctors, insurance, payers, patients
Business models generally fall into B2B SaaS or tech-enabled services. There’s no one “healthcare market” as it’s made of 1,000s of niches. The customers are generally very sticky but slow sales cycles (expect several months to get to a pilot) so growth isn’t quite as fast as traditional tech SaaS, but the customers’ spend is often strong so so these businesses can snowball well over time.
Epic Systems, Abridge, Candid Health, Doctronic, Doximity, OpenEvidence, Lemonade
Compound portfolio companies Tia, SuppCo, Talkspace
The tricky part is that scaled incumbents like Epic have already buried themselves into the core properties of CRM, clinical trial & EMR management. Just like in traditional tech SaaS, the prime “beach front” system of record properties of EHR, billing & CRM management command orders of magnitude more value than all other areas. Epic made $5B last year with such a sticky customer base that customers have almost never churned. Abridge is trying to leverage AI to take a more meaningful share of the EMR, but Epic now has their own offering and controls the data.
It’s possible that the key to building the next large-scale platform is changing distribution by going DTC. Compound has written extensively on this thesis and invested in several startups. This interview with the founder of OpenEvidence (which just hit $50M ARR as ChatGPT for doctors) also gives a good idea of navigating this path.


Of course, many businesses will not fit neatly into these business models. For example, companies in insurance, biotech platforms, therapeutics, diagnostics or medical devices are not included in this database and analysis.
While both cohorts of businesses are equally represented in this work, it’s worth noting that tech-enabled services are much more prevalent in the healthcare industry, representing approximately 70% of unicorns to-date and 80% of the public exits in the last five years. This is for good reason. Of the $4 trillion spent on healthcare in 2021, we estimate that three-quarters of that is the cost of delivering care and thus directly addressable by tech-enabled services businesses. A quarter of the total healthcare spend is attributed to administrative costs, of which today only about 10% is technology and software spend. While SaaS spend in healthcare is growing quickly, we are still in the early stages of digitization, leaving room for automation and reduction of administrative spend.

1. Market size and clear financial ROI matter
Similar to Cloud, Healthcare SaaS is a great business model with efficient and highly recurring revenues. However, adoption of software solutions in healthcare is low, as demonstrated by the overall breakdown of healthcare spend, which we estimate is only 10% of the $950 billion admin spend today. As a result, we have seen fewer healthcare SaaS companies achieve Centaur status ($100M+ ARR). As you can see from the benchmarks, average Healthcare SaaS companies have smaller total addressable markets (TAM) than the average Cloud counterparts given that they are operating in an industry vertical.
We encourage founders to find a wedge with a clear value proposition that supports a large enough TAM in order to build a category-defining company, as opposed to a one-point healthcare IT solution. It also requires a clear proof of financial ROI for the buyer where often a direct impact to revenue is preferred over reduction in costs. In addition, as companies hit $25M+ in revenue, like in any other vertical SaaS category, it’s valuable to identify what a second act would be to deliver more value. This can come from incremental applications, payment rails, and other indirect monetization features such as marketplaces.
2. Validate and match sales cycles by titrating sales and marketing spend
On average, we see healthcare SaaS companies growing 75% YoY compared to 95% YoY for Cloud businesses. This is largely due to smaller TAMs and fewer buyers in healthcare SaaS, contributing to what are often slower sales cycles and more enterprise-like go-to-market motions. Whether selling to hospitals, payers, employers, or pharma, it is widely known in the industry that sales can be sluggish given compliance requirements, bespoke integrations, and multiple stakeholders. Despite this, we see a similar CAC payback on a gross-margin adjusted basis likely driven by the lower spend in sales and marketing as a percent of revenue of 50% compared to 70% for cloud companies. We see that the best healthcare SaaS companies can titrate sales and marketing spend and employ a capital-efficient way to learn and validate sales motion and sales productivity. Use these learnings before ramping up a sales team as fewer end customers should mean fewer sales reps needed at scale. Ultimately, companies should strive to maintain efficient CAC paybacks below 20 months adjusted on a gross margin basis.
1. The sky’s the limit for growth
The market sizes for tech-enabled services are orders of magnitude larger than those of healthcare SaaS companies. While a healthcare SaaS or cloud business would have a TAM of $7-10 billion on average, tech-enabled service businesses have on average $100+ billion TAMs. Therefore, we see that on average tech-enabled services companies grow at ~100% year-over-year, which is faster even than the average cloud business while spending significantly less on sales and marketing (~30% less S&M as a percent of revenue than Cloud businesses).
For example, companies innovating in the kidney care space represent a $300 billion+ opportunity. This TAM is a top quartile or what we at Bessemer call a ‘best in class’ metric. (Kidney care spend is almost 1% of the entire US Federal Budget. Yes, you read that correctly, Federal—not just healthcare federal spend.) There are many specialty areas similar to kidney care that can be addressable with tech-enabled services including cardiology, MSK, maternal health, and oncology to name a few.
2. Delight your customers to expand your business
The majority of businesses we analyzed have a B2B2C go-to-market strategy. Similar to Healthcare SaaS, there are few payer and employer accounts to sell into, making the CAC payback an enterprise and mid-market-like motion. However, we have seen companies in the tech-enabled services category excel at expanding sales within a customer base, as shown in the high Net Dollar Revenue Retention (NDRR) metric of on average 140% year-over-year. NDRR is calculated as total revenue inclusive of expansion minus churn, which is contract expirations, member churn, cancellations, or downgrades. While revenue for tech-enabled services is transactional in nature, a strong NDRR is a strong indicator of the recurrent nature of top line revenue.
There are two drivers for account revenue expansion: (1) Net new patients reached and engaged within a given customer member population, and (2) increase in average revenue per user (ARPU). The first is impacted by an increase in incidence of disease or new patients diagnosed and engaged every year. Compared to SaaS which would often be compensated on a per/seat or enterprise contracts basis, tech-enabled services are compensated on a per member basis. Granted price points may be lower than software licenses, there are many more patients that can be engaged and thus a higher chance to increase the size of the contract and improve NDRR over time.
Increase in ARPU can be negotiated and ‘earned’, especially when the company demonstrates strong clinical outcomes and financial ROI on the clinical services. When we talk about ARPU, we refer to revenue per member in the form of fee-for-service payments, bundles, shared savings or capitation that ultimately align incentives across stakeholders, put the patient at the center and create value for the healthcare system. We also believe referenceable customers and proven outcomes will help tech-enabled services companies win business faster, thereby improving the scalability of the business model.
3. Gross profit is your North Star
It is no surprise that unit economics look drastically different for tech-enabled services and SaaS business models. However, this makes many onlookers scratch their heads as to how efficient these Tech-Enabled Services businesses can be and whether these companies should be venture-backed. Our answer is yes, they should be—given the high growth and highly recurring nature of top-line revenue, as well as the opportunity to drive unit economic improvement over time by leveraging technology to improve gross margins while creating value for patients and the system overall.
We have seen tech-enabled services companies make a steady progression from good (25% - bottom quartile) to best (60% - top quartile) to improve gross margins as they scale. There are several levers to improve gross margins and gross profit. Here’s the basic formula:
Gross profit = # of patients (volume) * Annual revenue per user (ARPU) - Cost of delivering service (COGS)
Technology will help you reduce COGS. However, the marginal cost of delivering care will vary by clinical model and condition acuity, among other reasons. We don’t expect all companies to leverage only light-touch-technology approaches but rather to leverage technology to enable clinicians and provide omnichannel experiences. Over time, companies can get better at managing the efficiency of their provider panels (i.e., increase the number of patients a provider can see over time) through better processes and technology, as well as by leveraging different types of providers operating at top of license (i.e., leverage health coaches, nurse practitioners). All of these levers can affect clinical quality and outcomes and thus require a delicate balance between technology deployment and robustness of clinical efficacy to improve how you deliver care. As discussed previously, strong financial and clinical ROI will help you negotiate ARPU over time.
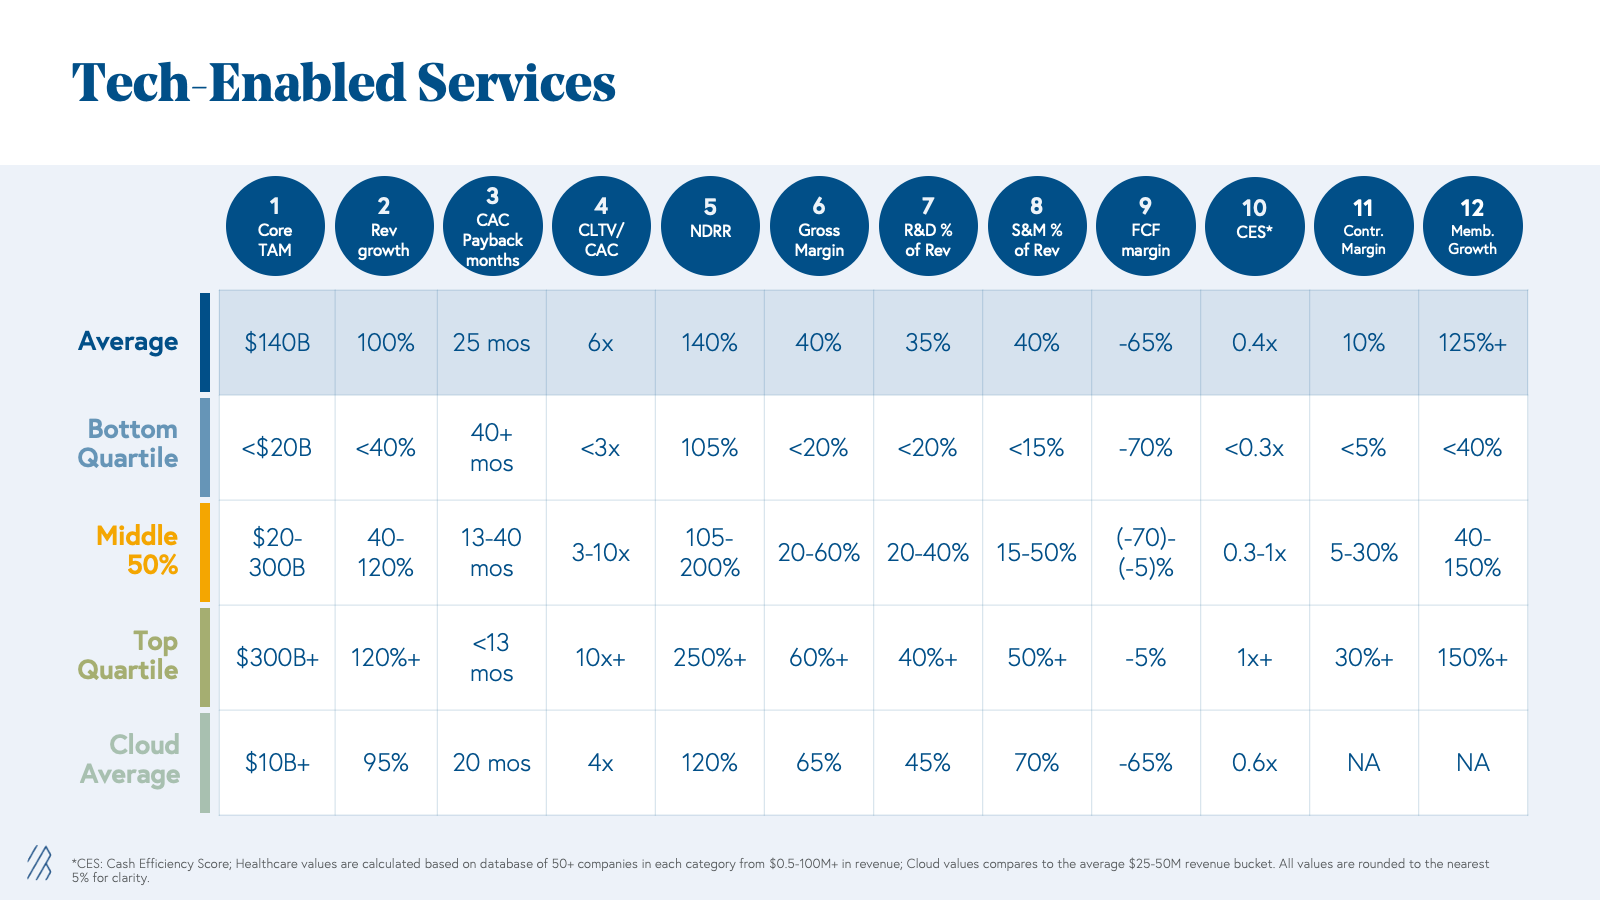
Benchmarks for growing health tech businesses
Healthcare AI-specific modalities
Diagnostics and therapeutics are modalities unique to healthcare. AI diagnostics support or automate the identification of disease through existing or new paradigms (e.g., AI for retinal imaging has been applied for diagnostics across cardiovascular, metabolic, and neurologic diseases) and can be reimbursable by cash pay, insurance, or enterprise contracts, such as in the context of AI biomarkers for clinical trials. Going to market with a clinical diagnostics tool is often more arduous and time-consuming than with other modalities because diagnostics require both regulatory approval and the trust and evangelism of practitioners, who (rightly) may be skeptical of AI operating within such a high-stakes area of patient care. But it’s not impossible, and there are creative ways to get to clinic. Some AI diagnostics companies have already overcome these barriers, including Cleerly in cardiology, Viz.ai | AI-Powered Care Coordination in neurology and cardiovascular, Digital Diagnostics in ophthalmology, and Tempus in oncology.
The other healthcare-specific modality is therapeutics, medical treatments designed to alleviate symptoms or cure disease. While there’s potential for companies to build AI-powered digital therapeutics that treat certain conditions — as we have seen with video game-style therapeutics for improving attention in children with ADHD — there are serious challenges related to adoption and reimbursement for this type of use case, and requiring stronger incentives to drive widespread uptake. The more common use case for AI in therapeutics is to aid in drug discovery and development. For example, Bessemer-backed Seismic Therapeutic is using machine learning and AI in drug discovery and development for autoimmune diseases, tackling key challenges such as mitigating immunogenicity.
In reality, companies will combine multiple modalities within a comprehensive solution. For instance, Qventus provides perioperative optimization solutions via software and agent-based services.
Business models
The modality of an AI product can help inform the best business model. While multiple business models can be deployed in tandem, we’ll define each one individually for the sake of simplicity. At a high level, there are two primary business model architectures: usage-based and performance-based.
| Usage-based | Performance-based |
| Linear, Usage-based: Pay a flat rate per unit of value Volumetric: Purchase an allowance based on expected product use, and pay overage fees if actual usage exceeds that allowance Bundled usage: A tiered usage-based model where additional features are available for higher prices Managed services: Pay bespoke fees for continuous outsourced services Device maintenance: Pay an upfront cost for the AI product (or recurring leasing cost) plus/minus annual maintenance fees | Performance-based linear: Flat rate per unit of value generated against determined criteria Shared savings: Charge a share of financial returns generated by a solution Hybrid shared savings: Recurring subscription fee plus a share of financial returns generated by a solution Discounted fixed costs: Recurring cost with discounts if certain clinical, financial, scientific, or engagement-based outcomes are not met Dynamic reimbursements: Higher per unit or percentage costs if certain positive outcomes are demonstrated |
For a deeper dive on some of these business models, read our Atlas piece on SaaS pricing models, as well as these deep dives on usage-based and performance-based models in healthcare.
Effects on TAM and gross margin
To illustrate the effects of modality and business model on a company’s TAM and gross margins, we’re using an example of a hypothetical startup innovating in the ophthalmology space.
For context, there are roughly 20,000 ophthalmologists and 50,000 optometrists in the US, 18 million retinal images taken every year, and seven million ocular injections made per year. In the 2010s, researchers developed a method of using retinal images to identify pathologies in areas other than the eye such as the precursors to diabetes. Our hypothetical startup has created an AI solution catalyzed by these developments.
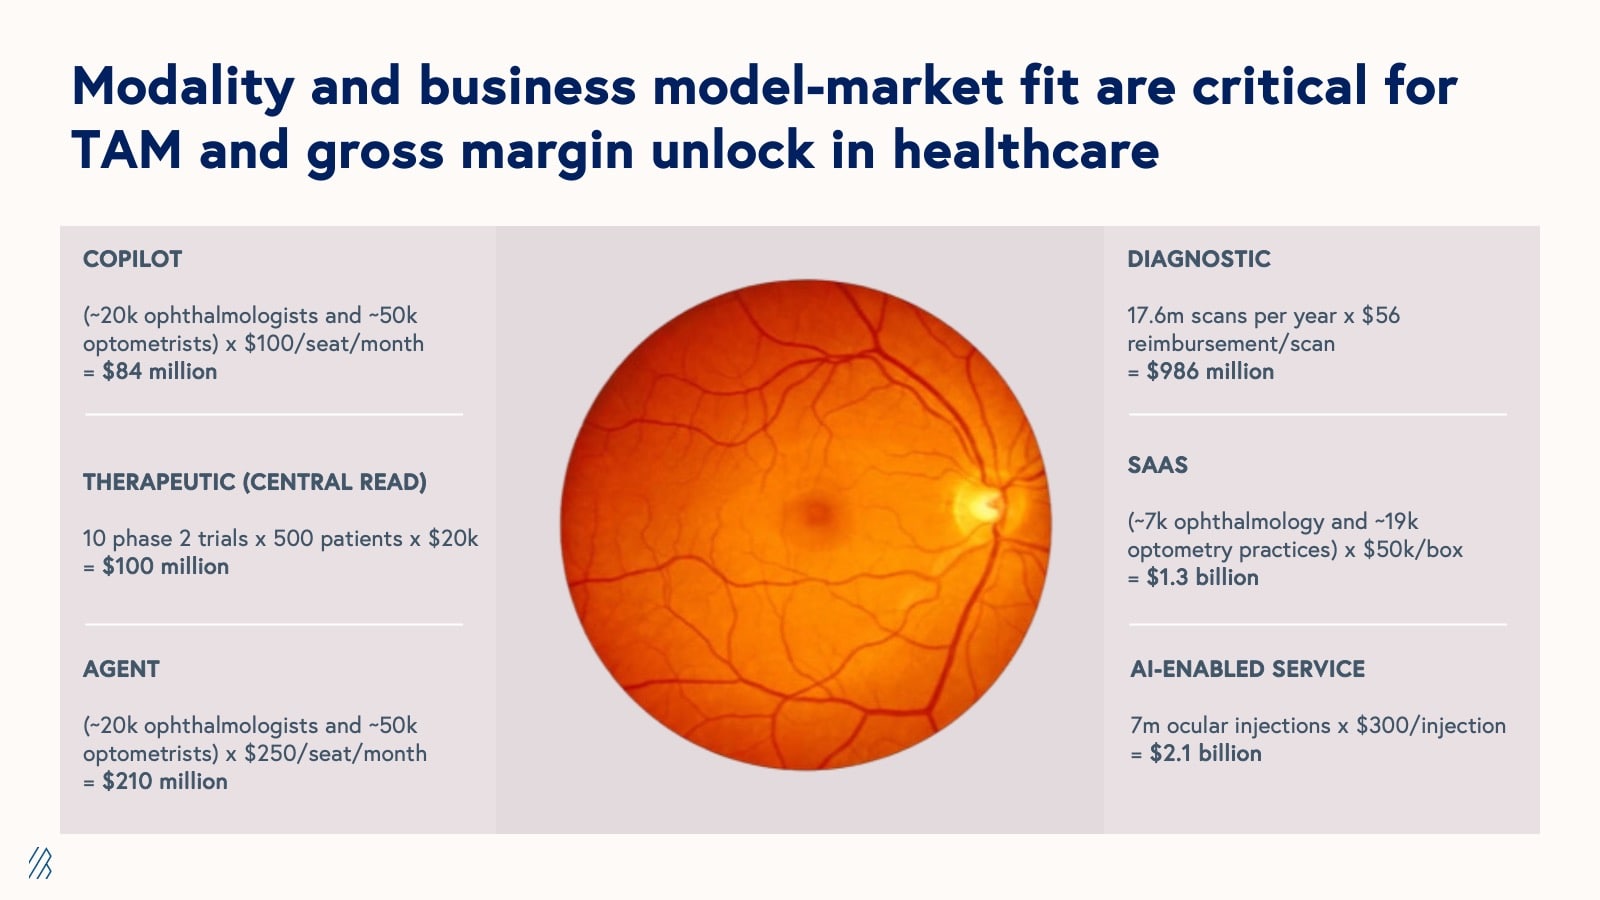
Depending on the modality and business model, the TAMs listed above range from $84 million (for a copilot product with a pay-per-seat SaaS model) to $2.1 billion (for an AI-enabled service that aids in ocular injections with a usage-based or “fee for service” pricing model).
As this example highlights, AI models, when deployed in isolation, often fail to capture their full potential value and can present adoption challenges for customers. To maximize value capture and facilitate smoother adoption, companies should consider vertically-integrated business models that use AI to enhance or reimagine existing workflows, effectively meeting customers where they are. These vertically integrated approaches not only solve more comprehensive problems but also tap into larger revenue streams across the value chain, thus expanding the addressable market size.
Consider the following examples of a targeted software solution and its vertically-integrated counterpart:
It’s worth noting that modality and business model can affect gross margins too, and there are often trade-offs between higher TAMs and healthier gross margins. For example, while the AI-enabled ocular injections service has a TAM of nearly twice that of the AI software product, SaaS has historically supported much higher gross margins than services in healthcare. But this convention is being challenged by AI companies, many of which are using AI to increase the efficiency of services-based delivery models.
| Modality | TAM | Margins |
| Agents | Small-Medium | Medium-High |
| AI Services | Medium-Large | Medium |
| Copilots | Small-Medium | Medium-High |
| Diagnostics | Small-Medium | High |
| SaaS | Small-Medium | High |
| Therapeutics | Wide-ranging | High |


Contrary to the long-standing belief that platforms fail at higher rates than non-platforms, recent analysis of nearly 5,000 digital health companies reveals that platform businesses successfully raise subsequent funding rounds and exit at higher rates than non-platform businesses.


By Monday morning, Trilogy’s configurator software was comprehensive but incredibly slow—on a good day, it could solve a very complex problem, but it would take 10 minutes. It would also crash about 60% of the time, which they sought to forestall by prestaging a particular configuration of a big SGI computer system for the sake of the demo. Of the six billion or so possible permutations, the Trilogy team knew of four that wouldn’t make it crash.
“Great,” he told Watson. “The price has tripled. It’s $300,000.”
“Done,” she told him.
Three months later, HP called. “It’s $3.5 million,” Liemandt said, understanding they’d abandoned their own configurator pursuit. They accepted.
Six months after the HP deal, AT&T called. Liemandt told them it cost $7.5 million. Done. Then IBM called, having abandoned its internal project, too. $25 million, Liemandt said, which would have been the biggest enterprise software deal in history to that point. IBM accepted. Then came Boeing, GE, Ford, and hundreds of others writing eight-figure checks.
